
An Efficient High-Resolution Global–Local Network to Detect Lunar Features for Space Energy Discovery


1
Department of Surveying and Mapping and Space Environment, Space Engineering University, Beijing 101407, China
2
Department of International Tourism, City University of Macau, Macau 999078, China
*
Author to whom correspondence should be addressed.
Remote Sens. 2022, 14(6), 1391; https://doi.org/10.3390/rs14061391
Submission received: 20 February 2022
/
Revised: 10 March 2022
/
Accepted: 10 March 2022
/
Published: 13 March 2022
(This article belongs to the Special Issue Computer Vision and Machine Learning for Remote Sensing Solutions Applied to Environmental Challenges)
Abstract
:Lunar craters and rilles are significant topographic features on the lunar surface that will play an essential role in future research on space energy resources and geological evolution. However, previous studies have shown low efficiency in detecting lunar impact craters and poor accuracy in detecting lunar rilles. There is no complete automated identification method for lunar features to explore space energy resources further. In this paper, we propose a new specific deep-learning method called high-resolution global–local networks (HR-GLNet) to explore craters and rilles and to discover space energy simultaneously. Based on the GLNet network, the ResNet structure in the global branch is replaced by HRNet, and the residual network and FPN are the local branches. Principal loss function and auxiliary loss function are used to aggregate global and local branches. In experiments, the model, combined with transfer learning methods, can accurately detect lunar craters, Mars craters, and lunar rilles. Compared with other networks, such as UNet, ERU-Net, HRNet, and GLNet, GL-HRNet has a higher accuracy (88.7 ± 8.9) and recall rate (80.1 ± 2.7) in lunar impact crater detection. In addition, the mean absolute error (MAE) of the GL-HRNet on global and local branches is 0.0612 and 0.0429, which are better than the GLNet in terms of segmentation accuracy and MAE. Finally, by analyzing the density distribution of lunar impact craters with a diameter of less than 5 km, it was found that: (i) small impact craters in a local area of the lunar north pole and highland (5°–85°E, 25°–50°S) show apparent high density, and (ii) the density of impact craters in the Orientale Basin is not significantly different from that in the surrounding areas, which is the direction for future geological research.
1. Introduction
With the rapid development of remote-sensing technology, researchers can quickly obtain large-scale and high-resolution images of planets to explore and discover space energy [1] and geological research [2]. The Moon is the closest natural body to the Earth in space, and it is well studied compared to other celestial bodies. By exploring rilles and impact craters on the Moon, we are more likely to find space energy because they have been a hot research topic [3].
The surface of the Moon is distributed with dark cracks known as rilles [4]. In [5], the Moon is rich in energy resources, such as helium-3, which is an efficient, clean, safe, and cheap nuclear fusion resource. The availability of helium-3 on the Moon is much higher than that on the Earth, and helium-3 has been proved to be abundant in the lunar stream [6]. The study of impact craters can be used to deduce geological age, to explore the existence of water ice [7], and to select landing sites for lunar rovers [8], autonomous navigation [9], and other tasks for deep space probes [10].
To explore and discover space energy sources and study geological evolution, we should first detect impact craters and rilles on the Moon’s surface. In the past, such detection was usually made visually and manually. However, this time-consuming and inaccurate approach requires the development of automated detection tools, particularly deep learning methods, to detect impact craters and rilles on the Moon.
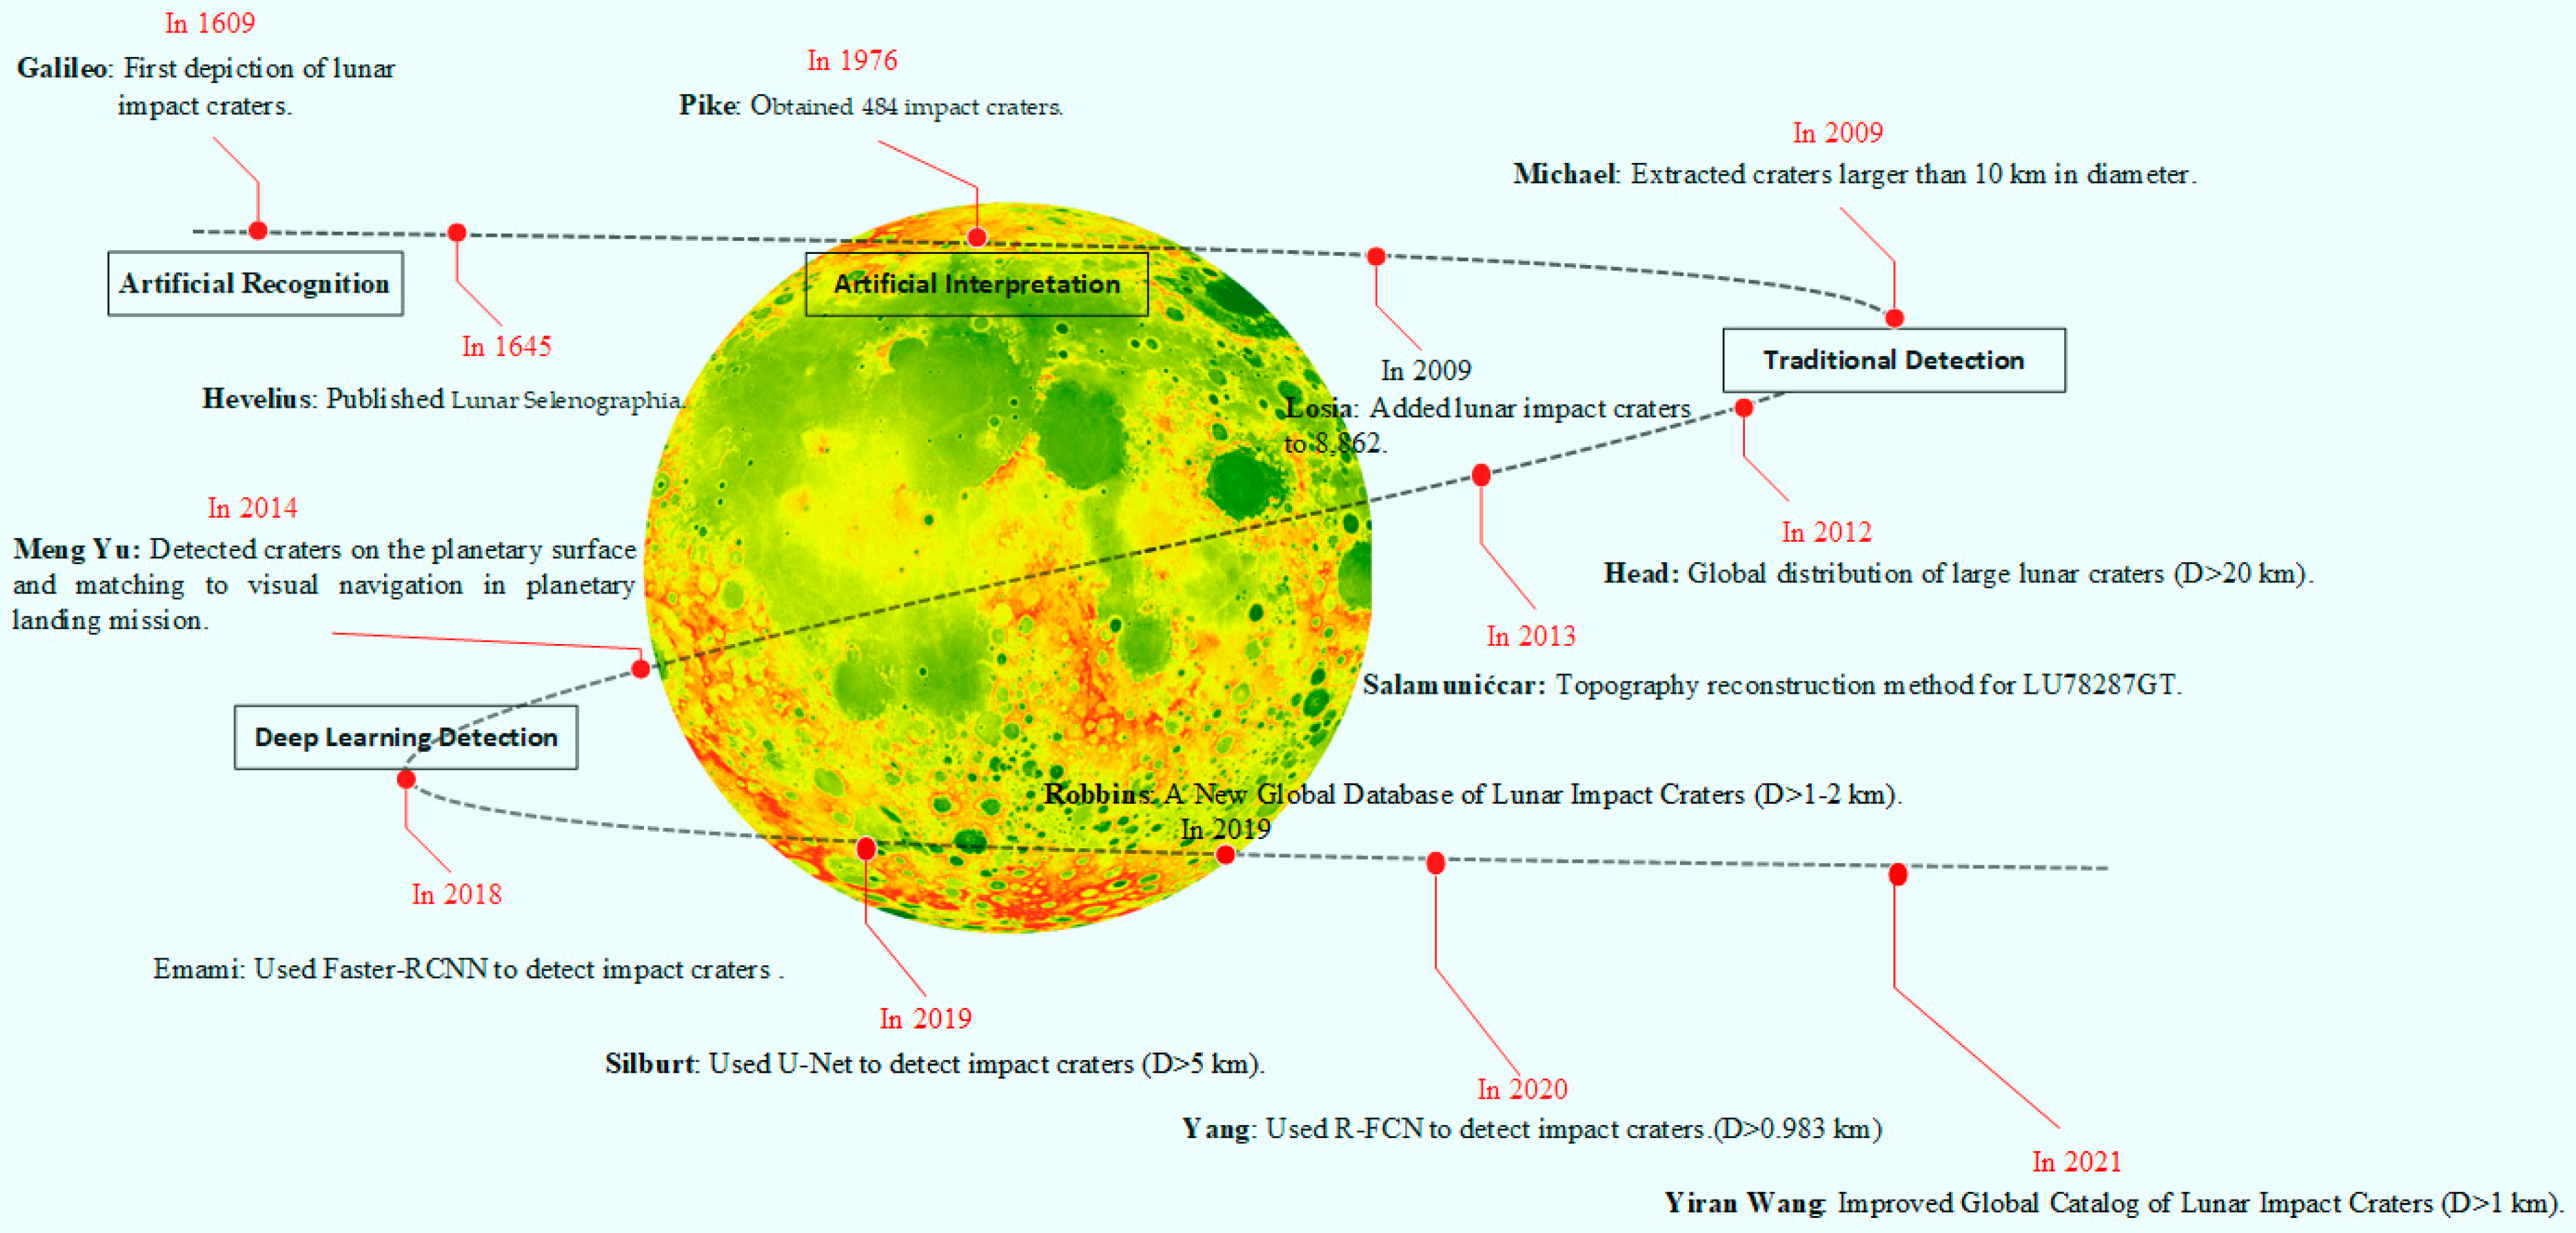
For example, The Lunar Selenographia published by Hevelius [11] mapped the lunar impact craters. Pike [12] obtained 484 impact craters and their scale parameters through Apollo stereo image data. However, with the acquisition of higher precision data, the problem of low accuracy and manual recognition efficiency becomes more prominent. Traditional recognition methods based on Hough transform [13], feature matching [14], image transformation segmentation [15], and quadratic curve fitting [16] have higher accuracy and more pronounced effects. Nonetheless, the calculation process of this method is also complicated and time-consuming, and further improvement is needed for global impact crater detection. In recent years, with the advent of AlexNet [17] and the rapid development of graphic processing unit (GPU) hardware, more researchers began to use the convolutional neural network (CNN) in deep learning to solve the tasks of object detection and semantic segmentation in computer vision. The method proposed by Silburt [18] applied the U-Net network framework to detect impact craters in the whole Moon and obtained relatively accurate detection results. DeLatte [19] built a Crater U-Net framework using Keras to make the database more prominent and to have a more significant recognition. Still, the accuracy of the detection needs to be improved. Yang [20] proposed a method based on Chang ‘E-1 and Chang E-2 digital elevation data (DEM) and the digital orthophoto image (DOM) and target detection framework R-FCN network to detect a total of 109,956 new impact craters. On this basis, the paper also analyzed the geological age. In addition, Jia [21] proposed an SCNeSt architecture with multipath representation and channel orientation of self-calibrated convolution, providing higher detection and estimation accuracy for small impact craters. Yang [22] designed an HRFPNet with a feature aggregation module (FAM) to extract the context information of small craters while preserving the features of small craters in deep convolution layers, and they built a dataset called Mars day crater detection (MDCD) consisting of 500 images. Twelve-thousand of them are 729 × 729 pixels in size. The development history of impact crater detection is shown in Figure 1:
In general, most methods are not used for space energy discovery. They are designed to probe only craters, not Moon rilles, directly related to lunar energy discoveries. The high-resolution net (HRNet) model proposed by Chen [23] is a depth model for human pose estimation. Still, this model’s accuracy rate (83.7%) and recall rate (53.8) are low, resulting in poor recognition performance. To further discover space energy accurately and efficiently, we designed a new specific deep-learning method called high-resolution global-local networks (HR-GLNet) to explore craters and rilles to discover space energy simultaneously. HR-GLNet can maintain high-resolution feature maps throughout the process and can obtain more accurate spatial information. Its multi-scale fusion strategy can also obtain richer high-resolution representations and make the predicted lunar features more accurate.
In summary, the contributions of this work are:
- To further promote lunar energy discovery, we propose a new machine-learning approach that automatically identifies craters and rilles simultaneously.
- We propose a new semantic segmentation method, GL-HRNet, which is superior to GLNet- and HRNet-based network structures in terms of segmentation accuracy and mean absolute error and can be easily used in other similar tasks.
- We also find something unique about the density distribution of craters throughout the Moon. There is a distinctive difference for a relatively small crater (1–5 km in diameter) between the density of impact craters on the lunar mare and the highland. Small craters on the lunar mare are deeper than those on the highlands.
The rest of this article is organized as follows. Section 2 introduces the proposed method, global branch HRNet, and local branch ResUnet of the GL-HRNet and branch aggregation algorithm. Section 3 introduces the experimental data, evaluation indexes, and experimental conditions. In addition, Section 4 evaluates lunar rilles and impact craters and compares the proposed network with other existing networks. Finally, Section 5 gives our conclusions and puts forward some opinions on the direction of future work.
2. Materials and Methods
By combining deep learning and transfer learning, we proposed the GL-HRNet for lunar energy detection based on GLNet [24], HRNet [25], and UNet [26], as shown in Figure 2. Firstly, projection, downsampling, and random clipping were carried out for different remote-sensing data to make complex data fragmentary. Secondly, in the global branch of GL-HRNet, the ResNet [27] in GLNet was adjusted to the HRNet, and the HRNet and feature pyramid network (FPN) [28] were taken as the backbone network. In this way, rich multi-scale information of craters and valleys was integrated while maintaining high-resolution feature maps. In the local branch, ResUNet and FPN were used as the backbone network to train the partial network independently without adopting the original feature sharing strategy to eliminate the uncertainty caused by inadequately-learned feature maps in the global branch. Finally, the primary loss function and the auxiliary loss function were used to make the global branch’s segmentation graph and the local branch’s segmentation output more accurate to the corresponding manual marking result, and the prediction graph was the output.
2.1. Global Branch of GL-HRNet
Inspired by the HRNet [25], in this paper, HRNet and FPN were used as main trunks to replace GLNet’s ResNet network. HRNet connects subnets from high resolution to low resolution in parallel, repeatedly fusing multi-resolution features to generate reliable high-resolution representations. Compared with the original ResNet network in GLNet, the resolution of the feature map is improved, and the global context information is enriched. In contrast, more detailed information is retained, improving segmentation efficiency. Its structure is shown in Figure 3.
Parallel multi-resolution subnets are constructed through parallel connections from high-resolution subnets to low-resolution subnets. Each subnet contains multiple convolutional sequences, and there is a down-sampling layer between adjacent subnets to halve the resolution of feature maps. The high-resolution subnet is used as the first stage, and the subnets from high resolution to low resolution are gradually added to form the new stage. Then multiple resolution subnets are connected in parallel. The resolution of the next phase of the parallel subnet consists of the resolution of the previous phase and the resolution of the next phase. The network structure consists of four parallel subnets, as shown in Figure 4.
Global branching introduces switching units across parallel subnets so that each subnet receives information from other subnets multiple times. An example of an information exchange unit is shown in Figure 4b, where stage 3 is divided into multiple switching blocks. Each switching block consists of three parallel convolutional units and one switching unit. The specific implementation of aggregation of feature information of different resolutions by exchanging units in GL-HRNet is shown in Figure 5.
The exchange unit takes s response graph {X1, X2…Xs,} as the input, each output is aggregated from the response graph of the input, and the corresponding output is {Y1, Y2…, Ys}, where Yi and Xi have the exact resolution and dimension. The expression from input to output is:
Each cross-stage switching unit has an additional output Ys+1, and
a(Xi, k) represents changing the resolution of input Xi from i to k, which is realized by down-sampling or up-sampling. The switching unit of the GL-HRNet global branch uses 3 × 3 convolution with a step size of 2 for down-sampling, while up-sampling is realized by bilinear interpolation. If I = k, then a(Xi, k) represents the identity mapping, a(Xi, k) = Xi.
2.2. Local Branch of GL-HRNet
Inspired by Unet [26] and ResNet [27], ResUNet is the backbone network in local branches. Unlike the original network, the proposed improved network does not share the feature map with the global branch depth. The global branch supplements the context information that the local branch lacks and confuses the learning of its feature graph. Therefore, independent training is adopted to improve the segmentation effect of local branches. The network structure of local branches is shown in Figure 6.
The FPN ResUnet network has an asymmetric structure and is an end-to-end model. There are 44 convolutional layers in the network, and there are four down-sampling and four up-sampling operations in total. There is no entire connection layer, and the output characteristics of each layer have enhanced semantic information. The coding part of the network is similar to the ResNet18 network, which can reduce the spatial dimension of the input image through convolution, pooling, and other operations to extract high-level features.
After each feature extraction with two residual structures, 2 × 2 maximum pooling was used to reduce the spatial dimension, filter out some unimportant high-frequency information, and reduce the spatial size of the feature map. To reduce the disappearance of gradient, the ReLu function was used for all activation functions of the model. Each residual structure contains a BN layer, and each batch is normalized to each level of characteristics in the coding path so that the distribution of each level is relatively stable, which can make the model have better robustness to a large extent, accelerate the convergence rate, and improve the capacity of the model.
2.3. Branch Ensemble
Feature maps extracted from local and global branches can be divided into L layers, represented by XL,I and XG,i, respectively, where i ∈ L, L = 4. The feature maps of the last layer are connected along the dimensions, and the final segmentation map is obtained by the aggregation layer fAGG, making it SAGG. In addition to the primary loss function of SAGG, two auxiliary loss functions were adopted in this paper to make the segmentation graphs of global branches SG,L and partial branches SL,L, respectively, which are closer to the corresponding artificial marking results (Ground Truth, GT). This operation also makes the training process more stable. As shown in Figure 7, the aggregation layer between the two branches was set as fAGG, composed of 3 × 3 convolution, and the ensemble between the feature maps of the two branches was realized.
3. Experiments
3.1. Dataset
In this paper, four kinds of different data sets were used for experiments: lunar digital elevation data SLDEM [29], Mars HRSC MOLA Blend DEM Global 200 m v2, Surface crack [30], and an assembled dataset [23]. The SLDEM data have a resolution of 59 m and span ±60° latitude (maximum longitude range). The global grayscale image was projected by equiangular cylindrical projection with a resolution of 184,320 × 61,440 pixels and a bit depth of 16 bits per pixel. According to Head [31] (D > 20 km) and Povilaitis [32], 5 km < D < 20 km of impact craters are needed to make the label data. The image data were then clipped into 256 × 256 images at a 50% overlap rate, 30,000 3000 and 3000 images were randomly selected and used for training, validation, and testing, respectively. The experiment data have a different resolution range from 150 m/pixel to 5500 m/pixel.
Similarly, Mars HRSC MOLA Blend DEM Global 200 m v2 has a resolution of 200 m across latitude ±90° (maximum longitude range). This global grayscale image is an isometric cylindrical projection with a resolution of 106,694 × 53,347 pixels and a bit depth of 16 bits per pixel. According to Robbins and Hynek [33], D > 4 km of craters are needed to make the label data, and they need cropped to 256 × 256 pixels to detect Mars impact craters. The whole image was also cropped with a 50% overlap, and 30,000 3000 and 3000 images are randomly selected and used for training, validation, and testing, respectively. The experiment data have a different resolution range from 400 m/pixel to 12.8 km/pixel.
There are currently no valley annotation data set on the surface of the Moon, inspired by [30] pavement crack detection. Thus, we chose to include pavement crack in the concrete, membrane, and crack-tile as the training data set. Because cracks on the surface of the concrete have different characteristics and these images and valley image characteristics are similar to the Moon rilles, feature similarity is high. For surface crack data, 200 images were selected from the Crack500 data set, including 50 images of thin-film cracks, 50 concrete cracks, and 100 images of cracked bricks. All images were randomly sorted, and 160 images were selected for training, 20 images for validation, and 20 images for testing.
The assembled data set, referred to as the data set of [23], was carefully selected from the online library published by NASA and the national astronomical observatories of China, and it screened 44 clear images of impact craters and Moon rilles from 1000 images. The image size was 256 × 256 pixels. To prevent the over-fitting problem of the limited sample of the inefficient data set, the specific data set was trained by fine-tuning the pre-training weights obtained from the lunar digital elevation model and the surface crack data set with a relatively small learning rate of ten epochs. To test the recognition effect of Moon rilles, the data set randomly shuffled all images, 35 of which were selected for training and the remaining nine for testing. The different types of data sets are shown in Table 1 and Figure 8.
3.2. Evaluation Metrics
Computer configuration in the experiment was comprised of two NVIDIA TITAN GPUs with 24 Gb of memory, a Ubuntu18.04 operating system, Cuda10.0, Cudnn7.5, and Opencv3.5.6, and it used Keras framework for training.
The precision-recall (P-R) curve and average precision (AP) values were used in this experiment to objectively test the accuracy of the target detection algorithm.
where NTP is the number of correctly detected crater targets in the formula, and NFP is the number of mis-detected targets. The recall in the P-R curve represents the missed detection rate of the algorithm:
where NFN is the missed meteorite crater target.
The F1 value is a statistical index used to measure the accuracy of the dichotomous model. This index takes into account both the accuracy and recall rate of the classification model. The F1 value can be defined as a weighted average of model accuracy and recall rate as:
where P and R are the accuracy and recall rates, respectively.
The false-positive rate of crater identification in this paper is also called the discovery rate (DR). The first discovery rate (DR1) was the ratio of newly discovered craters to all known craters. The second discovery rate (DR2) was the ratio of newly discovered craters to the number of all impact craters (recognized and unrecognized crates). They are defined as follows:
The latitude error (Errorla), longitude error (Errorlo), and radius error (Errorr) of identifying meteorite craters are, respectively, calculated by the following formula:
where lop is the predicted longitude of the impact crater; lot is the corresponding actual meteor crater longitude value; lap is the predicted latitude value of the crater; lat is the corresponding real crater latitude value; rp is the predicted crater radius value; rt is the corresponding real crater radius value.
3.3. Training Details
In training the convolutional neural network, it was necessary to set some of the super parameters, the learning rate, the training iteration volume, and the selection of loss function. The parameter settings are shown in Table 2.
The downsampled image of global branch input and the clipped image of local branch input adopted 256 × 256-pixel size. The local branch of the adjacent overlap, cut out of the subgraph, had a pixel to avoid the boundary of the convolution layer disappearing and used the γ = 6 lord loss function and two auxiliary loss functions [34] to optimize the target. The global branch adopted multilevel loss calculation, with each branch loss weight evenly distributed to 1, and the local branch adopts binary cross-entropy loss function.
where yi is the label of pixel i in the prediction result of GL-HRNet, and ti is the label of this pixel in the image truth value. Image loss is the sum of all pixel loss. If the difference between the predicted image and the labeled image is large, the loss value will be large.
The mean absolute error was used as the evaluation standard during the experiment. MAE is the average absolute value of the deviation between a single observed value and the standard value. All individual differences have equal weight on the average value, which can better reflect the actual situation of the predicted value error, and its expression is shown as follows:
where x is the input data set; m is the total amount of data in x; h is the prediction process; h(xi) and yi are the predicted and typical values of the apex data, respectively.
4. Results and Discussion
4.1. Analysis of the Lunar Impact Crater Detection Results
This section experiments with different networks, including UNet [26], ResUnet [35], GLNet [24], HRNet [23], and GL-HRNet. There were 30,000 training images, 3000 verification images, and 3000 test images. The recognition results of the different networks are shown in Figure 9:
As can be seen from Figure 9, the test data came from different latitudes, and the recognition effects of the different models were different. The ResUnet, compared to U-Net, added a residual module and recognized more craters. The HRNet found new craters better than GLNet, but with less accuracy. The GL-HRNet also combined the advantages of ResUnet and HRNet networks, which can detect smaller impact craters and perform better for overlapping impact craters, closely related to the aggregation method. The experiments show that GL-HRNET was better than the global branch HRNet and the local branch ResUnet.
To further verify the algorithm’s performance, different models were tested using evaluation indexes on 3000 test images and 3000 validation images. The recognition results of each algorithm are shown in Table 3.
For Table 3, in the test data set, the detection error rate of the GL-HRNet model we proposed was lower than that of other models, in which the latitude error rate was 5.89%, the longitude error rate was 6.97%, the radius error rate was 3.68%, and the detection ability of the model was better. The accuracy rate and recall rate were also higher than those of Silburt’s UNet [18], reaching 88.7% and 80.1%, respectively. In addition, the F1 score of the GL-HRNet model was slightly higher than that of the GLNet model, reaching 79.4%, which is related to the high-resolution network characteristics. Compared with ResUnet, the DR1 (19.3 ± 1.7) and DR2 (16.2 ± 3.2) of the GL-HRNet model were higher, indicating that our proposed network has a higher ability to identify new impact craters.
On the global branch, GL-HRNet was compared with GLNet and HRNet. The comparison of mean absolute error and memory usage is shown in Table 4.
On the local branch, GL-HRNet was compared with the network structure of feature graph sharing in GLNet. The comparison of mean absolute error and memory usage is shown in Table 5.
In the global branch, MAE = 0.0612 of the GL-HRNet main structure was used in this paper, and the mean absolute error was 0.01 lower than that of GLNet. As shown in Figure 9, the segmentation result graph of GL-HRNet was also significantly better than that of GLNet, proving that the structure proposed in this paper can perform impact crater segmentation better in the global branch. In the local branch, the ResUNet network was used to replace ResNet without integrating it into the global branch feature graph. The mean absolute error (MAE = 0.0429) was lower, and the structure segmentation effect was better without feature graph sharing.
4.2. Analysis of Mars Impact Craters and Moon Rilles Detection Results
To verify the robustness of the GL-HRNet model, based on transfer learning, the trained lunar model was tested in the Mars data set. The size of the image sample is chosen from a list of sizes from 512 to 16,384 pixels to provide a range of scales from 400m/pixel to 12.8km/pixel, and the detection results are shown in Figure 10:
As shown in Figure 10, for Mars images with different resolutions, the model could accurately identify impact craters on Mars, and more new impact craters could be found, which lays a foundation for the next step of Mars data research and morphology analysis.
To further verify the recognition effect of the GL-HRNet model on rilles, 160 Surface crack images were trained, tested, and verified in the assembled data set using the method of transfer learning. The recognition results are shown in Figure 11:
As can be seen from the recognition results in the figure, despite the insufficient samples on the lunar surface, the crack model based on transfer learning training can recognize impact craters and had an accurate recognition effect on the identification of the lunar stream. Compared with other models, the GL-HRNet had broader applicability and a more potent migration ability. However, it can also be seen that different data significantly impacted the results, and high-resolution images are essential for future research.
4.3. Density Analysis of Lunar Impact Craters
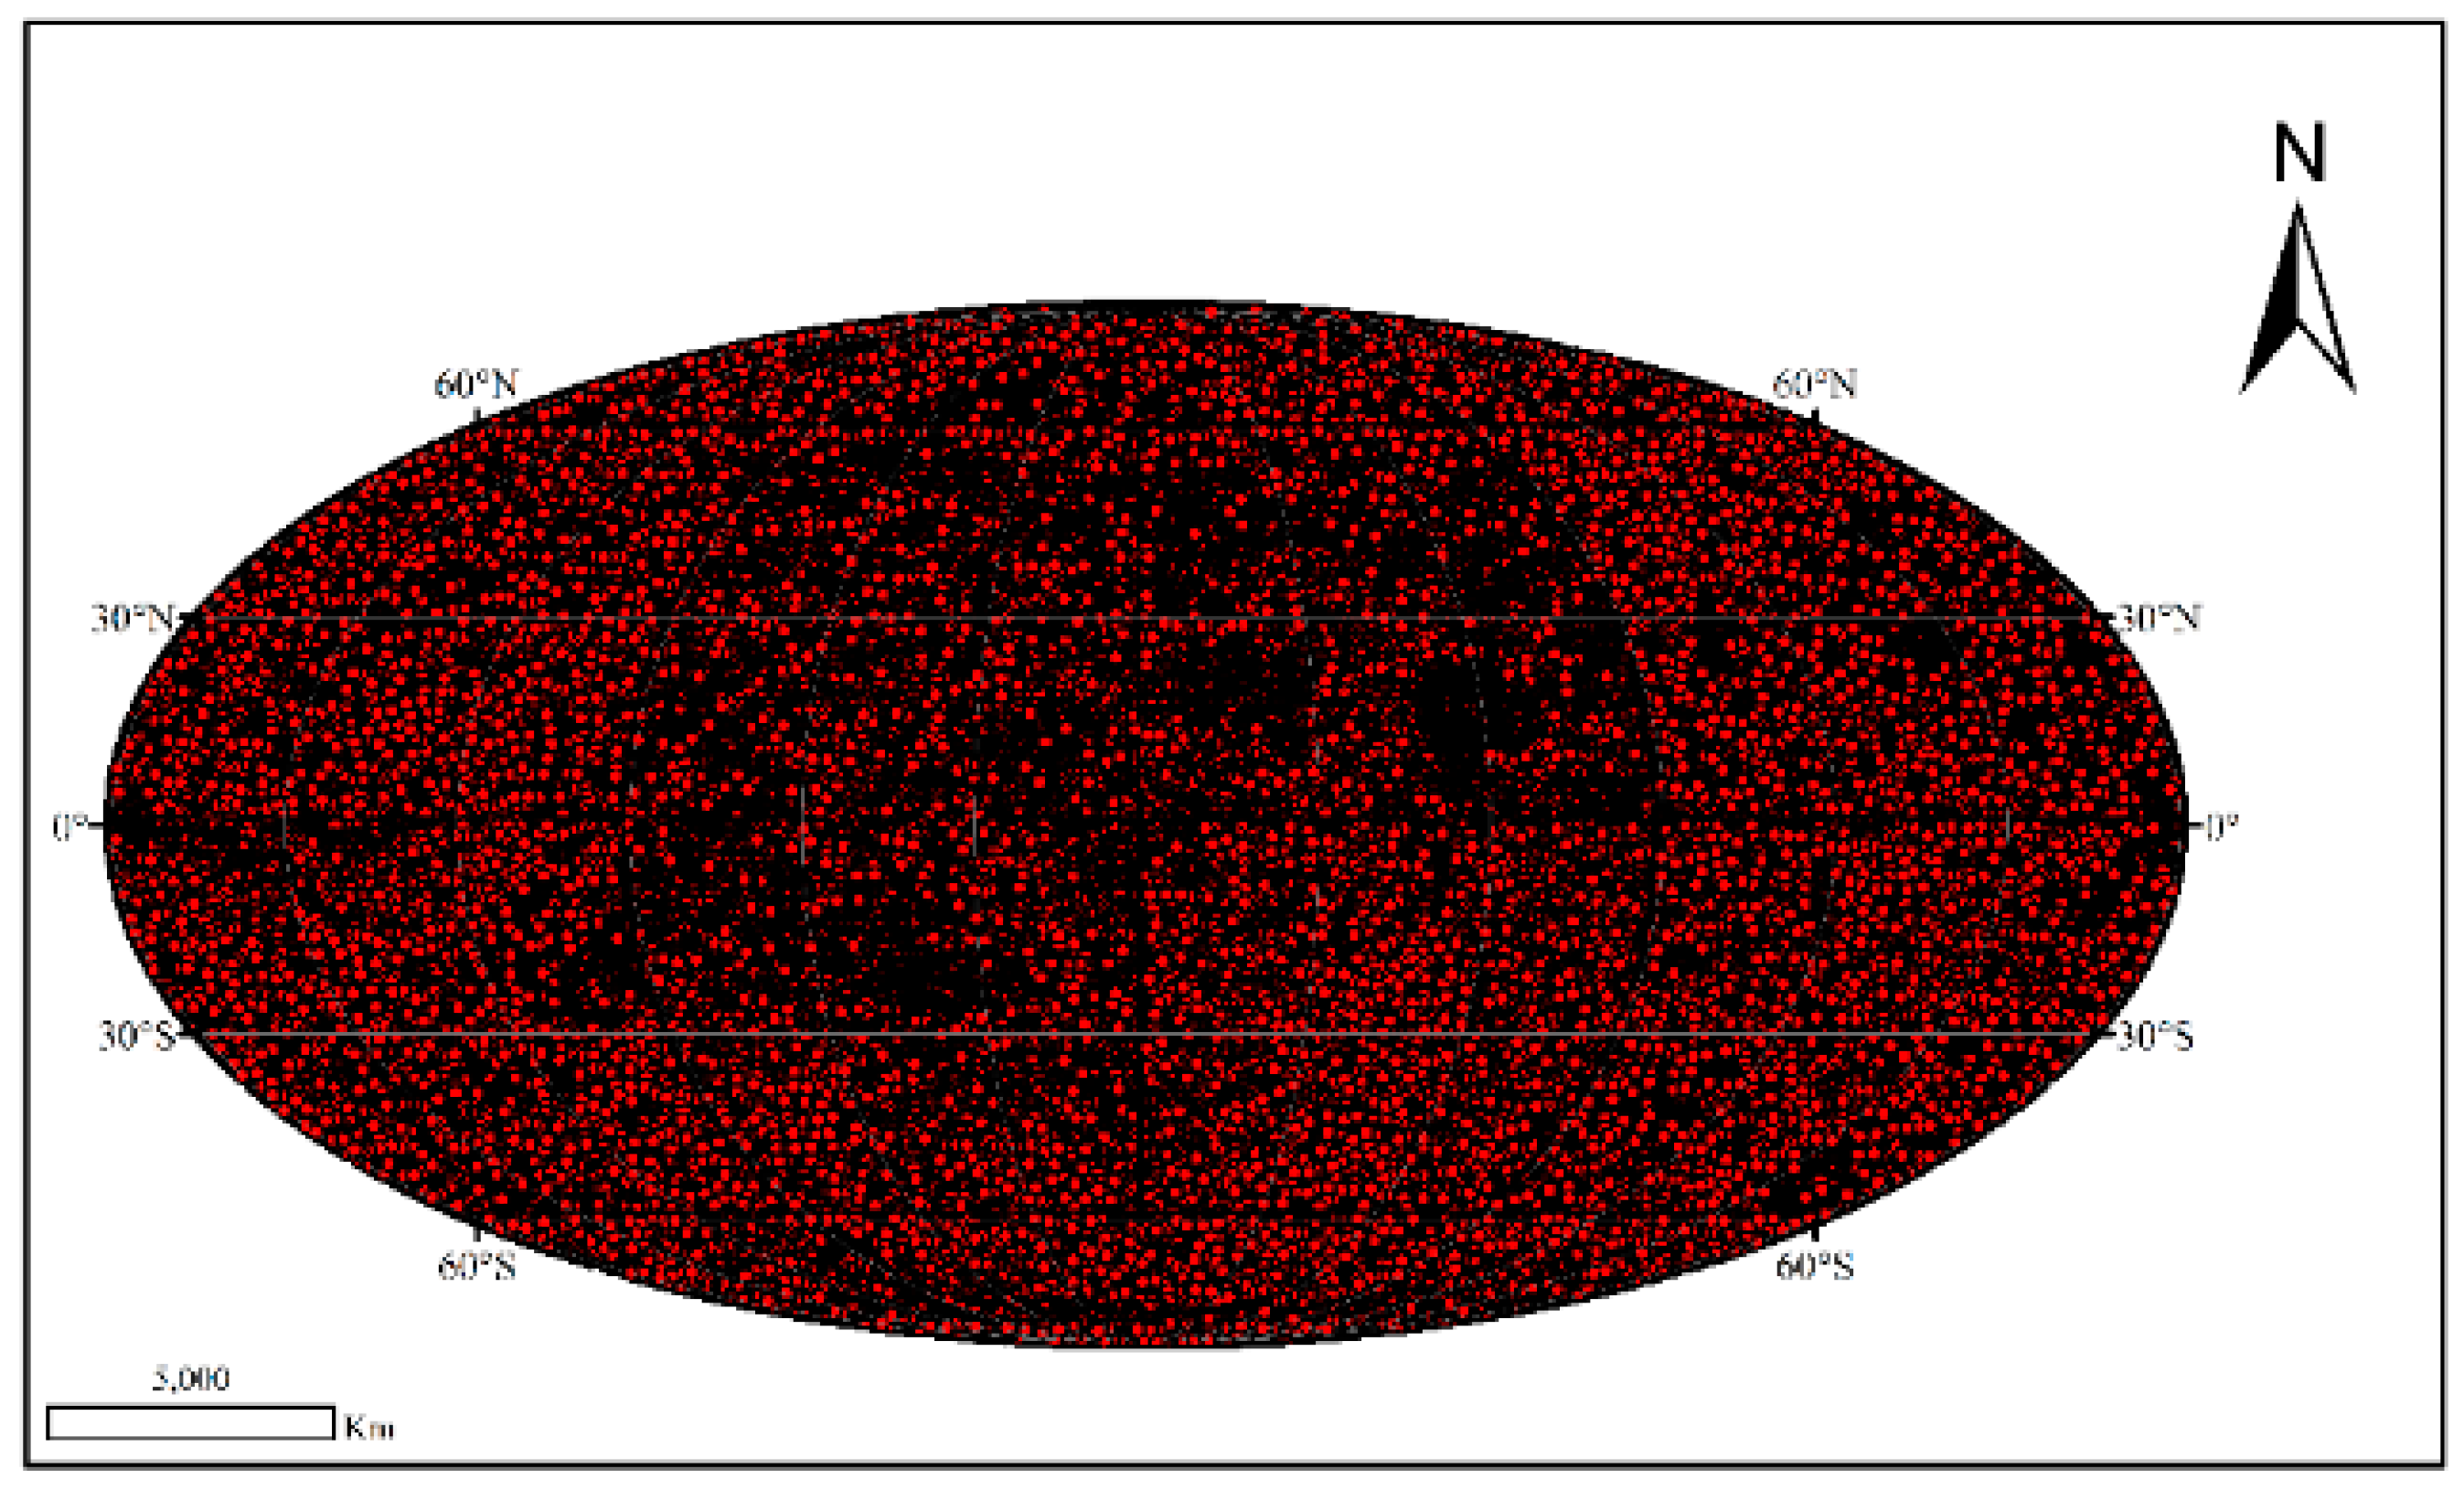
The craters’ density is the number of craters per unit area. The distribution of impact craters in the Moon is shown in Figure 12, which was a total of 176,534 impact craters, among which the minimum diameter was 0.5 km and the maximum diameter was 860 km. It can be found that there are many impact craters on the lunar surface, and they are widely distributed.
The density of impact craters with different diameters was analyzed to further study the density distribution of lunar impact craters at different scales. The density diagram of impact craters with diameters greater than 20 km is shown as Figure 13:
As shown in Figure 13, the density of impact craters with diameters greater than 20 km in the Orientale Basin on the lunar surface was significantly different from that in the surrounding areas, with high density. At the same time, the large craters in the western region (165°–150°S, 25°–35°N) showed a high-density distribution. For impact craters with a diameter of 5–20 km, their density map is shown in Figure 14:
As can be seen from Figure 14, most craters are concentrated in the Orientale Basin, and the western region (115°W–125°W, 10°N–15°N) showed apparent high density, similar to the density distribution of those with diameters greater than 20 km. The density map of impact craters with a diameter less than 5 km is shown in Figure 15:
For small craters less than 5 km in diameter, the following new findings were made:
- (1)
- The difference boundary of impact crater density is highly consistent with the boundary between lunar mare and highlands;
- (2)
- Small impact craters at the North Pole and a local region of the Moon’s highlands (5°–85°E, 25°–50°S) show significant density;
- (3)
- Compared with the density of craters with diameters of more than 5 km, the density of craters with diameters of 1 to 5 km in the Orientale Basin is not significantly different from those in the surrounding area.
5. Conclusions
In this paper, based on the combination of deep learning and transfer learning, a lunar feature detection method (GL-HRNet) combining high-resolution features and improved GLNet was used to further promote lunar energy discovery and geological research. In this method, the ResNet in GLNet is adjusted to HRNet, and the HRNet and FPN are used as the backbone network, which integrates rich multi-scale information of craters and valleys while maintaining high-resolution feature maps. Secondly, ResUNet and FPN are used as the backbone network in the local branch and are trained independently. The primary loss function and auxiliary loss function aggregation are used to make the global branch’s segmentation graph and the local branch’s segmentation output more accurate to the corresponding manual labeling results. Compared with different CNN network structures, GL-HRNet model has higher accuracy (88.7 ± 8.9) and recall rate (80.1 ± 2.7) and smaller latitude and longitude error. In addition, the model has a good effect on the identification of Mars impact craters, more new impact craters are found, and the robustness is higher for the detection of Moon rilles. Finally, by analyzing the density distribution of lunar impact craters with a diameter of less than 5 km, it was found that the density of small impact craters in the North Pole and a local area of the lunar highlands (5°–85°E, 25°–50°S) is obviously high. The density of impact craters in the Orientale Basin is not significantly different from that in the surrounding areas.
Author Contributions
Data curation, M.F.; funding acquisition, G.W.; project administration, Y.J.; resources, L.L.; software, L.L.; validation, Y.J.; visualization, S.P.; writing—original draft, Y.J.; writing—review and editing, Y.J. All authors have read and agreed to the published version of the manuscript.
Funding
This research received no external funding.
Institutional Review Board Statement
Not applicable.
Informed Consent Statement
Not applicable.
Data Availability Statement
In this study, using Chang-E data download address for Chinese lunar exploration data and information system, web site for https://moon.bao.ac.cn/moonGisMap.search (accessed on 19 February 2022). In addition, the use of the LRO DEM data and SLDEM data, as well as Mars in the USGS DEM data, download website, https://planetarymaps.usgs.gov/mosaic/ (accessed on 19 February 2022).
Acknowledgments
The authors would like to thank the Space Engineering University for its hardware support and NASA’s lunar digital elevation model data. The authors would like to express their gratitude to EditSprings (https://www.editsprings.com/ (accessed on 19 February 2022)) for the expert linguistic services provided.
Conflicts of Interest
The authors declare no conflict of interest.
Abbreviations
The following abbreviations are used in this manuscript:
| HR-GLNet | High-resolution global-local networks |
| MAE | Mean absolute error |
| GPU | Graphics processing unit |
| CNN | Convolutional neural network |
| DEM | Digital elevation model |
| DOM | Digital orthophoto map |
| FAM | Feature aggregation module |
| RPN | Region proposal network |
| MDCD | Mars day crater detection |
| HR-Net | High-resolution network |
| FPN | Feature pyramid network |
| GT | Ground truth |
| AP | Average precision |
| DR | Discovery rate |
References
- Crawford, I.A.; Anand, M.; Cockell, C.S.; Falcke, H.; Green, D.A.; Jaumann, R.; Wieczorek, M.A. Back to the Moon: The scientific rationale for resuming lunar surface exploration. Planet. Space Sci. 2012, 74, 3–14. [Google Scholar] [CrossRef] [Green Version]
- Yue, Z.; Di, K.; Wan, W.; Liu, Z.; Gou, S.; Liu, B.; Peng, M.; Wang, Y.; Jia, M.; Liu, J.; et al. Updated lunar cratering chronology model with the radiometric age of Chang’e-5 samples. Nat. Astron. 2022. [Google Scholar] [CrossRef]
- Zhang, T.; Li, Y.; Chen, Y.; Feng, X.; Zhu, X.; Chen, Z.; Yao, J.; Zheng, Y.; Cai, J.; Song, H.; et al. Review on space energy. Appl. Energy 2021, 292, 116896. [Google Scholar] [CrossRef]
- Mcgill, G.E. Attitude of fractures bounding straight and arcuate lunar rilles. Icarus 1971, 14, 53–58. [Google Scholar] [CrossRef]
- Koohrokhi, T.; Azadifar, R. Effect of Internal Breeding of Tritium and Helium-3 on the Ignition of an ICF Fuel Pellet. J. Fusion Energy 2016, 35, 493–497. [Google Scholar] [CrossRef] [Green Version]
- Simko, T.; Gray, M. Lunar Helium-3 Fuel for Nuclear Fusion: Technology, Economics, and Resources. World Future Rev. 2014, 6, 158–171. [Google Scholar] [CrossRef]
- Honniball, C.I.; Lucey, P.G.; Li, S.; Shenoy, S.; Orlando, T.M.; Hibbitts, C.A.; Hurley, D.M.; Farrell, W.M. Molecular water detected on the sunlit Moon by SOFIA. Nat. Astron. 2021, 5, 121–127. [Google Scholar] [CrossRef]
- Rosa, D.D.; Bussey, B.; Cahill, J.T.; Lutz, T.; Crawford, I.A.; Hackwill, T.; Gasselt, S.V.; Neukum, G.; Witte, L.; Mcgovern, A. Characterisation of Potential Landing Sites for the European Space Agency’s Lunar Lander Project. Planet. Space Sci. 2012, 74, 224–246. [Google Scholar] [CrossRef] [Green Version]
- Downes, L.M.; Steiner, T.J.; How, J.P. Neural Network Approach to Crater Detection for Lunar Terrain Relative Navigation. J. Aerosp. Inf. Syst. 2021, 18, 391–403. [Google Scholar] [CrossRef]
- Lagain, A.; Servis, K.; Benedix, G.K.; Norman, C.; Anderson, S.; Bland, P.A. Model Age Derivation of Large Martian Impact Craters, Using Automatic Crater Counting Methods. Earth Space Sci. 2021, 8, e2020EA001598. [Google Scholar] [CrossRef]
- Montanari, A.; Koeberl, C. Impact Stratigraphy; Springer: New York, NY, USA, 2000; pp. 1–7. [Google Scholar]
- Pike, R.J. Crater dimensions from Apollo data and supplemental sources. Moon 1976, 15, 463–477. [Google Scholar] [CrossRef]
- Luo, L. Global detection of large lunar craters based on the CE-1 digital elevation model. Front. Earth Sci. 2013, 7, 456–464. [Google Scholar] [CrossRef]
- Liu, A.; Zhou, D.; Chen, L.; Chen, M. Saliency detection and edge feature matching approach for crater extraction. J. Syst. Eng. Electron. 2015, 26, 1291–1300. [Google Scholar] [CrossRef]
- Pedrosa, M.M.; de Azevedo, S.C.; da Silva, E.A.; Dias, M.A. Improved automatic impact crater detection on Mars based on morphological image processing and template matching. Geomat. Nat. Hazards Risk 2017, 8, 1306–1319. [Google Scholar] [CrossRef]
- Kim, J.R.; Muller, J.P.; Van Gasselt, S.; Morley, J.G.; Neukum, G. Automated Crater Detection, A New Tool for Mars Cartography and Chronology. Photogramm. Eng. Remote Sens. 2015, 71, 1205–1218. [Google Scholar] [CrossRef] [Green Version]
- Technicolor, T.; Related, S.; Technicolor, T.; Related, S. ImageNet Classification with Deep Convolutional Neural Networks. In Proceedings of the Neural Information Processing Systems 2012, Lake Tahoe, NV, USA, 3–6 December 2012; pp. 1097–1105. [Google Scholar]
- Silburt, A.; Ali-Dib, M.; Zhu, C.; Jackson, A.; Valencia, D.; Kissin, Y.; Tamayo, D.; Menou, K. Lunar crater identification via deep learning. Icarus 2019, 317, 27–38. [Google Scholar] [CrossRef] [Green Version]
- DeLatte, D.M.; Crites, S.T.; Guttenberg, N.; Yairi, T. Automated crater detection algorithms from a machine learning perspective in the convolutional neural network era. Adv. Space Res. 2019, 64, 1615–1628. [Google Scholar] [CrossRef]
- Yang, C.; Zhao, H.; Bruzzone, L.; Benediktsson, J.A.; Liang, Y.; Liu, B.; Zeng, X.; Guan, R.; Li, C.; Ouyang, Z. Lunar impact crater identification and age estimation with Chang’E data by deep and transfer learning. Nat. Commun. 2020, 11, 6358. [Google Scholar] [CrossRef]
- Jia, Y.; Wan, G.; Liu, L.; Wang, J.; Wu, Y.; Xue, N.; Wang, Y.; Yang, R. Split-Attention Networks with Self-Calibrated Convolution for Moon Impact Crater Detection from Multi-Source Data. Remote Sens. 2021, 13, 3193. [Google Scholar] [CrossRef]
- Yang, S.; Cai, Z. High-Resolution Feature Pyramid Network for Automatic Crater Detection on Mars. IEEE Trans. Geosci. Remote Sens. 2022, 60, 1–12. [Google Scholar] [CrossRef]
- Chen, S.; Li, Y.; Zhang, T.; Zhu, X.; Sun, S.; Gao, X. Lunar features detection for energy discovery via deep learning. Appl. Energy 2021, 296, 117085. [Google Scholar] [CrossRef]
- Chen, W.; Jiang, Z.; Wang, Z.; Cui, K.; Qian, X. Collaborative Global-Local Networks for Memory-Efficient Segmentation of Ultra-High Resolution Images. In Proceedings of the 2019 IEEE/CVF Conference on Computer Vision and Pattern Recognition (CVPR), Long Beach, CA, USA, 15–18 March 2019; pp. 8916–8925. [Google Scholar]
- Sun, K.; Xiao, B.; Liu, D.; Wang, J. Deep High-Resolution Representation Learning for Human Pose Estimation. In Proceedings of the 2019 IEEE/CVF Conference on Computer Vision and Pattern Recognition (CVPR), Long Beach, CA, USA, 15–18 March 2019; pp. 5686–5696. [Google Scholar]
- Ronneberger, O.; Fischer, P.; Brox, T. U-Net: Convolutional Networks for Biomedical Image Segmentation. arXiv 2015, arXiv:1505.04597. [Google Scholar]
- He, K.; Zhang, X.; Ren, S.; Sun, J. Deep Residual Learning for Image Recognition. In Proceedings of the 2016 IEEE Conference on Computer Vision and Pattern Recognition (CVPR), Las Vegas, NV, USA, 27–30 June 2016; pp. 770–778. [Google Scholar]
- Lin, T.Y.; Dollar, P.; Girshick, R.; He, K.; Hariharan, B.; Belongie, S. Feature Pyramid Networks for Object Detection. In Proceedings of the 2017 IEEE Conference on Computer Vision and Pattern Recognition (CVPR), Honolulu, HI, USA, 21–26 July 2017; pp. 936–944. [Google Scholar]
- Barker, M.K.; Mazarico, E.M.; Neumann, G.A.; Zuber, M.T.; Smith, D.E. A new lunar digital elevation model from the Lunar Orbiter Laser Altimeter and SELENE Terrain Camera. Icarus 2016, 273, 346–355. [Google Scholar] [CrossRef] [Green Version]
- Yang, F.; Zhang, L.; Yu, S.; Prokhorov, D.; Mei, X.; Ling, H. Feature Pyramid and Hierarchical Boosting Network for Pavement Crack Detection. IEEE Trans. Intell. Transp. Syst. 2020, 21, 1525–1535. [Google Scholar] [CrossRef] [Green Version]
- Head, J.W.; Fassett, C.I.; Kadish, S.J.; Smith, D.E.; Zuber, M.T.; Neumann, G.A.; Mazarico, E. Global Distribution of Large Lunar Craters: Implications for Resurfacing and Impactor Populations. Science 2010, 329, 1504–1507. [Google Scholar] [CrossRef]
- Povilaitis, R.Z.; Robinson, M.S.; van der Bogert, C.H.; Hiesinger, H.; Meyer, H.M.; Ostrach, L.R. Crater density differences: Exploring regional resurfacing, secondary crater populations, and crater saturation equilibrium on the moon. Planet. Space Sci. 2018, 162, 41–51. [Google Scholar] [CrossRef]
- Robbins, S.J.; Hynek, B.M. A new global database of Mars impact craters ≥1 km: 1. Database creation, properties, and parameters. J. Geophys. Res. Planets 2012, 117, 872–892. [Google Scholar] [CrossRef]
- Lin, T.Y.; Goyal, P.; Girshick, R.; He, K.; Dollár, P. Focal Loss for Dense Object Detection. IEEE Trans. Pattern Anal. Mach. Intell. 2017, 42, 318–327. [Google Scholar] [CrossRef] [Green Version]
- Wang, S.; Fan, Z.; Li, Z.; Zhang, H.; Wei, C. An Effective Lunar Crater Recognition Algorithm Based on Convolutional Neural Network. Remote Sens. 2020, 12, 2694. [Google Scholar] [CrossRef]
Figure 1.
The development timeline of impact crater detection.

Figure 2.
End-to-end automatic lunar feature extraction network based on the HR-GLNet.

Figure 3.
The structure of the global branch of GL-HRNet.

Figure 4.
Basic network structure of HRNet [25]. (a) Parallel network structure. (b) Scale fusion network structure. (Nsr represents the subnet in the s stage, and its resolution is 1/(2r−1) of the image in the initial stage. Csrb represents the b switching block of the s stage, and the resolution of its switching unit is 1/(2r−1) of the initial stage, while εsb represents the corresponding switching unit.)

Figure 5.
Exchange unit of HRNet.

Figure 6.
The structure of the local branch of GL-HRNet.

Figure 7.
The process of aggregation.

Figure 8.
The four different types of data sets in the experiment.

Figure 9.
Crater detection results of different networks. (a) Ground-truth labels from the raw images; (b) the results of U-Net. (c) The recognition results of ResUnet. (d) The recognition results of GLNet. (e) The recognition results of HRNet. (f) The recognition results of our proposed GL-HRNet. Blue circles denote correctly-recognized craters. Green circles denote new craters, while red circles represent unrecognized craters.


Figure 10.
The results of the Mars impact crater detection from GL-HRNet. (a) Mars origin DEM. (b) Ground truth. (c) Prediction.
Figure 10.
The results of the Mars impact crater detection from GL-HRNet. (a) Mars origin DEM. (b) Ground truth. (c) Prediction.


Figure 11.
On the lunar surface, prediction results of the assembled data set from the National Aeronautics and Space Administration (NASA) and China National Astronomical Observatory’s published online library. (a) Moon surface image. (b) Ground truth of craters. (c) Prediction of craters and rilles.

Figure 12.
The impact crater distribution map of the Moon. (The bottom image is the DOM image of Chang E-2 with a resolution of 7 m, Mollweide projection, and the impact crater is the detection result of the GL-HRNet model.)
Figure 12.
The impact crater distribution map of the Moon. (The bottom image is the DOM image of Chang E-2 with a resolution of 7 m, Mollweide projection, and the impact crater is the detection result of the GL-HRNet model.)

Figure 13.
The density map of lunar impact craters (D > 20 km).

Figure 14.
The density map of lunar impact craters (5 km < D < 20 km).

Figure 15.
The density map of lunar impact craters (D < 5 km).


Table 1.
Four different types of data sets for training, validation, and testing.
| Data Set | Type | Samples | |||
|---|---|---|---|---|---|
| Crater | Rille | Train | Validation | Test | |
| Moon DEM | √ | × | 30,000 | 10,000 | 10,000 |
| Mars DEM | √ | × | 30,000 | 10,000 | 10,000 |
| Surface crack | × | √ | 160 | 20 | 20 |
| Assembled data set | √ | √ | 35 | - | 9 |
Table 2.
The model super parameters.
| Learning Rate | Training Batches | Training Wheels | Objective Function | Adam | |
|---|---|---|---|---|---|
| Global branch | 0.0001 | 100 | 100 | Focal loss | 0.9 |
| Local branch | 0.00002 | 100 | 100 | Binary cross-entropy | 0.999 |
Table 3.
The detection results of different network models on the validation data set and test data set. (Bold in the table indicates the best results of this evaluation index.)
Table 3.
The detection results of different network models on the validation data set and test data set. (Bold in the table indicates the best results of this evaluation index.)
| Method | Data Set | Errorla (%) | Errorlo (%) | Errorra (%) | Recall (%) | F1 (%) | Precision (%) | DR1 (%) | DR2 (%) |
|---|---|---|---|---|---|---|---|---|---|
| UNet | Val set | 7.43 | 9.97 | 8.98 | 69.2 ± 3.3 | 59.8 ± 4.3 | 73.2 ± 8.9 | 12.3 ± 2.1 | 11.2 ± 1.1 |
| Test set | 9.24 | 9.64 | 7.24 | 76.1 ± 2.3 | 62.8 ± 6.3 | 83.2 ± 10.9 | 13.3 ± 2.5 | 13.7 ± 2.1 | |
| ResU-Net | Val set | 7.86 | 8.93 | 5.83 | 72.4 ± 3.2 | 73.2 ± 2.5 | 79.3 ± 4.7 | 18.7 ± 3.2 | 15.4 ± 3.1 |
| Test set | 6.82 | 7.42 | 4.92 | 77.4 ± 2.4 | 77.2 ± 3.3 | 81.3 ± 7.6 | 18.7 ± 3.2 | 15.4 ± 3.1 | |
| GLNet | Val set | 7.32 | 8.71 | 3.72 | 72.1 ± 5.8 | 71.5 ± 2.6 | 78.1 ± 2.9 | 14.3 ± 3.8 | 12.8 ± 1.6 |
| Test set | 6.53 | 7.12 | 3.91 | 78.1 ± 3.8 | 77.5 ± 2.3 | 80.1 ± 5.9 | 17.3 ± 2.8 | 14.8 ± 3.2 | |
| HRNet | Val set | 10.19 | 10.23 | 7.26 | 74.6 ± 4.3 | 79.1 ± 4.3 | 85.3 ± 6.2 | 17.1 ± 3.4 | 13.7 ± 2.7 |
| Test set | 9.49 | 7.58 | 9.78 | 73.8 ± 2.5 | 76.4 ± 5.3 | 83.7 ± 9.5 | 16.3 ± 2.7 | 13.2 ± 2.1 | |
| GL-HRNet | Val set | 6.15 | 7.94 | 4.84 | 78.1 ± 3.4 | 77.4 ± 2.7 | 84.7 ± 7.9 | 12.5 ± 1.7 | 13.4 ± 3.2 |
| Test set | 5.89↓ | 6.97↓ | 3.68↓ | 80.1 ± 2.7 | 79.4 ± 4.3 | 88.7 ± 8.9 | 19.3 ± 1.7 | 16.2 ± 3.2 |
Table 4.
Comparison of global branch experiments.
| MAE | GPU Memory/M | |
|---|---|---|
| GLNet | 0.0730 | 1980 |
| GL-HRNet | 0.0612 | 2432 |
Table 5.
Comparison of local branch experiments.
| MAE | GPU Memory/M | |
|---|---|---|
| GLNet | 0.0572 | 1900 |
| GL-HRNet | 0.0429 | 1854 |
Publisher’s Note: MDPI stays neutral with regard to jurisdictional claims in published maps and institutional affiliations. |
© 2022 by the authors. Licensee MDPI, Basel, Switzerland. This article is an open access article distributed under the terms and conditions of the Creative Commons Attribution (CC BY) license (https://creativecommons.org/licenses/by/4.0/).
Share and Cite
MDPI and ACS Style
Jia, Y.; Liu, L.; Peng, S.; Feng, M.; Wan, G. An Efficient High-Resolution Global–Local Network to Detect Lunar Features for Space Energy Discovery. Remote Sens. 2022, 14, 1391. https://doi.org/10.3390/rs14061391
AMA Style
Jia Y, Liu L, Peng S, Feng M, Wan G. An Efficient High-Resolution Global–Local Network to Detect Lunar Features for Space Energy Discovery. Remote Sensing. 2022; 14(6):1391. https://doi.org/10.3390/rs14061391
Chicago/Turabian StyleJia, Yutong, Lei Liu, Siqing Peng, Mingyang Feng, and Gang Wan. 2022. "An Efficient High-Resolution Global–Local Network to Detect Lunar Features for Space Energy Discovery" Remote Sensing 14, no. 6: 1391. https://doi.org/10.3390/rs14061391
Note that from the first issue of 2016, this journal uses article numbers instead of page numbers. See further details here.